Polling vs WebSockets - Part 2 - Stress Testing
In my previous blog post, I discussed the efficiency of polling compared to WebSockets for a web application. Using these two different implementations and performance tests, I decided it would be interesting to perform some stress testing to see which solution can handle the most load.
All code on github here. For details of the original problem and performance tests, see here
The JMeter test report showed me errors like the following example:
Again, the WebSocket tests failed with errors indicating the client had to wait longer than the maximum timeout for a response. The theory of a GC collection slowing down the performance doesn't explain why Polling was unaffected. These errors seemed hard to explain so I decided to add some logging on the server in order to establish where the delays were coming from.
The logging revealed that the server was responding in a timely manner. The log entries below show that job with id ending "f2e34477fc57" had been sent over the WebSocket just one millisecond after it was marked as complete.
INFO [2018-06-19 21:30:16,038] com.github.phillbarber.job.JobService: Job: 6daba92d-2e09-41cc-bfcf-f2e34477fc57 Delay: 9985ms
INFO [2018-06-19 21:30:26,023] com.github.phillbarber.job.JobService: Job 6daba92d-2e09-41cc-bfcf-f2e34477fc57 is complete
INFO [2018-06-19 21:30:26,023] com.github.phillbarber.job.JobService: Job 6daba92d-2e09-41cc-bfcf-f2e34477fc57 is complete
INFO [2018-06-19 21:30:26,024] com.github.phillbarber.job.JobSocket: Job 6daba92d-2e09-41cc-bfcf-f2e34477fc57 has been sent to client by socket
My next point of call was to try and add extra logging to the performance tests. Sadly, there seemed no way to be able to do this with the JMeter-WebSocketSampler. I tried adding a "Debug Post Processor" which wrote many variables to the JMeter console, however it didn't show any detail of the WebSocket response to determine which jobs were slow.
I realised that the logging above was before the session was closed and not after. To log the "total" round trip time, each Job was given a create time as follows:
Then the following logging code was added:
Those eagle eyed may also realise that session.close(200) was replaced by session.close. This was after I realised that the status_code does not relate to http status codes and was actually throwing an error stating org.eclipse.jetty.websocket.api.ProtocolException: Out of range close status code: 200. I never could quite find what is a valid number until I looked into the implementation of session.close and found that it uses the status code of 1000 to indicate a non error scenario. I'm still confused as to what these status codes represent so if anyone can point me in the direction of an explanation please do!
The output from this code was telling...
INFO [2018-06-20 20:55:44,308] com.github.phillbarber.job.JobService: Job: 106a3332-adc6-4541-9601-60c4c5a35be4 Delay: 9148ms
INFO [2018-06-20 20:55:54,393] com.github.phillbarber.job.JobService: Job 106a3332-adc6-4541-9601-60c4c5a35be4 is complete
INFO [2018-06-20 20:55:54,494] com.github.phillbarber.job.JobService: Job 106a3332-adc6-4541-9601-60c4c5a35be4 is complete
INFO [2018-06-20 20:55:54,495] com.github.phillbarber.job.JobSocket: Job 106a3332-adc6-4541-9601-60c4c5a35be4 has been sent to client by socket. Start to finish: 10187
All code on github here. For details of the original problem and performance tests, see here
Let's increase the threads until it fails
Even with a low number of threads, occasionally I would encounter errors - most likely soon after the server had started in its new Docker container. Therefore I decided to run each scenario three times and display all results.
Scenario - 40 Threads
- Job duration 0-10 seconds
- 40 Threads/Users - Instant ramp up
- Each Thread creating 10 jobs
- Polling interval of 500ms
- Timeout: 11 seconds
Results - Some Errors from WebSocket implementation
- Run 1
- Polling - 0 errors
- WebSockets - 0 errors
- Run 2
- Polling - 0 errors
- WebSockets - 2 errors
- Run 3
- Polling - 0 errors
- WebSockets - 0 errors
What are the errors?
The JMeter test report showed me errors like the following example:
The operation lasted too long: It took 11,771 milliseconds, but should not have lasted longer than 11,000 milliseconds.
However crucially it didn't tell me which job ids were too slow. My theory at this stage was that given the tests are very time sensitive - it's possible that one of the runs coincided with a GC run and delayed a few jobs.
Scenario - 60 Threads
Results - More errors on WebSockets - Polling error free
- Run 1
- Polling - 0 errors
- WebSockets - 0 errors
- Run 2
- Polling - 0 errors
- WebSockets - 3 errors
- Run 3
- Polling - 0 errors
- WebSockets - 4 errors
Again, the WebSocket tests failed with errors indicating the client had to wait longer than the maximum timeout for a response. The theory of a GC collection slowing down the performance doesn't explain why Polling was unaffected. These errors seemed hard to explain so I decided to add some logging on the server in order to establish where the delays were coming from.
override fun onWebSocketConnect(sess: Session?) {
    super.onWebSocketConnect(sess)
    var storeJob = jobService.storeJob(Job())
    storeJob.subscribe(Action1 { remote!!.sendString(objectMapper.writeValueAsString(it))
        logger.info("Job ${it.id} has been sent to client by socket")
        session.close(200, "Done")
    })
}
The logging revealed that the server was responding in a timely manner. The log entries below show that job with id ending "f2e34477fc57" had been sent over the WebSocket just one millisecond after it was marked as complete.
INFO [2018-06-19 21:30:16,038] com.github.phillbarber.job.JobService: Job: 6daba92d-2e09-41cc-bfcf-f2e34477fc57 Delay: 9985ms
INFO [2018-06-19 21:30:26,023] com.github.phillbarber.job.JobService: Job 6daba92d-2e09-41cc-bfcf-f2e34477fc57 is complete
INFO [2018-06-19 21:30:26,023] com.github.phillbarber.job.JobService: Job 6daba92d-2e09-41cc-bfcf-f2e34477fc57 is complete
INFO [2018-06-19 21:30:26,024] com.github.phillbarber.job.JobSocket: Job 6daba92d-2e09-41cc-bfcf-f2e34477fc57 has been sent to client by socket
My next point of call was to try and add extra logging to the performance tests. Sadly, there seemed no way to be able to do this with the JMeter-WebSocketSampler. I tried adding a "Debug Post Processor" which wrote many variables to the JMeter console, however it didn't show any detail of the WebSocket response to determine which jobs were slow.
How to identify the slow responses - More logging
I realised that the logging above was before the session was closed and not after. To log the "total" round trip time, each Job was given a create time as follows:
data class Job (val id: String = UUID.randomUUID().toString(),
                val createTime: Long = Instant.now().toEpochMilli(),
                var complete: Boolean = false)
Then the following logging code was added:
override fun onWebSocketConnect(sess: Session?) {
    super.onWebSocketConnect(sess)
    var storeJob = jobService.storeJob(Job())
    storeJob.subscribe(Action1 {        remote!!.sendString(objectMapper.writeValueAsString(it))
        try{
            session.close()
        }
        catch (e: Exception){
            logger.error(e.toString())
        }
        logger.info("Job ${it.id} has been sent to client by socket AND CLOSED. Start to finish: " + (Instant.now().toEpochMilli() - it.createTime ))
    })
}
Those eagle eyed may also realise that session.close(200) was replaced by session.close. This was after I realised that the status_code does not relate to http status codes and was actually throwing an error stating org.eclipse.jetty.websocket.api.ProtocolException: Out of range close status code: 200. I never could quite find what is a valid number until I looked into the implementation of session.close and found that it uses the status code of 1000 to indicate a non error scenario. I'm still confused as to what these status codes represent so if anyone can point me in the direction of an explanation please do!
The output from this code was telling...
INFO [2018-06-20 20:55:44,308] com.github.phillbarber.job.JobService: Job: 106a3332-adc6-4541-9601-60c4c5a35be4 Delay: 9148ms
INFO [2018-06-20 20:55:54,393] com.github.phillbarber.job.JobService: Job 106a3332-adc6-4541-9601-60c4c5a35be4 is complete
INFO [2018-06-20 20:55:54,494] com.github.phillbarber.job.JobService: Job 106a3332-adc6-4541-9601-60c4c5a35be4 is complete
INFO [2018-06-20 20:55:54,495] com.github.phillbarber.job.JobSocket: Job 106a3332-adc6-4541-9601-60c4c5a35be4 has been sent to client by socket. Start to finish: 10187
Jobs aren't completing quite as timely as I thought. Above, we see a Job with a delay of 9,148ms but a start to finish time of 10,187ms which is a significant amount of time extra. This example shouldn't be enough to make the JMeter client timeout but it does illustrate that the extra time could be coming from closing the session/connection.
Running the server within my IDE (InteliJ Idea) in debug mode, whilst JMeter sent it requests also revealed an interesting quirk. Once the response of a completed job was sent to the client, if the server took a long time to close the connection, the test still passed. However, the next request for that thread failed. This would make debugging quite difficult since if the server was slow closing the connection for one job, it would actually be the next job created by the same JMeter thread that would error.
The above test scenario shows that as load increases, the socket implementation will start to get slower. It seems that the extra time causing the test to fail is coming from opening and closing connections.
I experimented by removing the CPU and Memory constraints, which resulted in the problem going away. This lead me to look at other stats available via docker's api including the throttling stats.
Web Sockets
Polling
Polling uses three times the cpu but seems to only gets throttled fifty percent more. In other words, it seems that the WebSocket implementation is being throttled proportionally more by Docker.
Whilst reading more about docker throttling, I found another way to try and mimic an aws ec2 t2.micro spec on my laptop (which was the original goal). You can specify a set of cores to allocate a docker container. I changed my bash script as follows:
From:
docker run --kernel-memory=1024m --cpus=0.125 --name polling-vs-sockets -d -p 8080:8080 -p 8081:8081 $FULL_IMAGE_NAME /startServerInDocker.sh
To:
docker run --memory=1024m --cpuset-cpus=0 --name polling-vs-sockets -d -p 8090:8080 -p 8081:8081 $FULL_IMAGE_NAME /startServerInDocker.sh
See my commit here. This would limit the docker container to just one core. Given my laptop has 8 cores, I expected to see similar performance. However this change alone brought about an astonishing increase in throughput (and resulted in zero throttled periods). Suddenly the scenarios I ran before with 60 threads gave 0 errors and the threads could be increased hugely as seen below.


Removing the last few scenarios from the graph (before the WebSocket errors go completely sky high) reveals that even before the tipping point is exceeded for WebSockets, it was consistently failing more frequently than it's Polling counterpart.
Running the server within my IDE (InteliJ Idea) in debug mode, whilst JMeter sent it requests also revealed an interesting quirk. Once the response of a completed job was sent to the client, if the server took a long time to close the connection, the test still passed. However, the next request for that thread failed. This would make debugging quite difficult since if the server was slow closing the connection for one job, it would actually be the next job created by the same JMeter thread that would error.
Conclusion - Part I
The above test scenario shows that as load increases, the socket implementation will start to get slower. It seems that the extra time causing the test to fail is coming from opening and closing connections.
I experimented by removing the CPU and Memory constraints, which resulted in the problem going away. This lead me to look at other stats available via docker's api including the throttling stats.
Web Sockets
- Total Bytes sent/received 901KB
- Bytes received: 507KB
- Bytes sent: 393KB
- CPU 2.17 seconds
- Throttled Periods: 80
Polling
- Total Bytes sent/received 5MB
- Bytes received: 2.8MB
- Bytes sent: 2.2MB
- CPU 6.9 seconds
- Throttled Periods: 121
Polling uses three times the cpu but seems to only gets throttled fifty percent more. In other words, it seems that the WebSocket implementation is being throttled proportionally more by Docker.
Stress Test Part 2 - Limiting the CPU by cores - not shares
Whilst reading more about docker throttling, I found another way to try and mimic an aws ec2 t2.micro spec on my laptop (which was the original goal). You can specify a set of cores to allocate a docker container. I changed my bash script as follows:
From:
docker run --kernel-memory=1024m --cpus=0.125 --name polling-vs-sockets -d -p 8080:8080 -p 8081:8081 $FULL_IMAGE_NAME /startServerInDocker.sh
To:
docker run --memory=1024m --cpuset-cpus=0 --name polling-vs-sockets -d -p 8090:8080 -p 8081:8081 $FULL_IMAGE_NAME /startServerInDocker.sh
See my commit here. This would limit the docker container to just one core. Given my laptop has 8 cores, I expected to see similar performance. However this change alone brought about an astonishing increase in throughput (and resulted in zero throttled periods). Suddenly the scenarios I ran before with 60 threads gave 0 errors and the threads could be increased hugely as seen below.
Polling Results
| JMeter Threads | Number of errors | MB Received | MB Sent | MB Sent/Received | CPU Seconds |
|---|---|---|---|---|---|
| 100 | 0 | 4.41 | 3.51 | 7.92 | 20.84 |
| 150 | 0 | 6.83 | 5.45 | 12.28 | 17.00 |
| 200 | 0 | 9.02 | 7.19 | 16.21 | 14.21 |
| 250 | 0 | 10.96 | 8.74 | 19.69 | 16.83 |
| 300 | 0 | 13.11 | 10.46 | 23.57 | 16.87 |
| 350 | 0 | 14.67 | 11.71 | 26.38 | 18.67 |
| 400 | 0 | 16.48 | 13.17 | 29.64 | 21.2 |
| 450 | 0 | 17.54 | 14.01 | 31.56 | 24.44 |
| 500 | 1 | 18.79 | 14.99 | 33.77 | 24.81 |
| 550 | 1 | 19.51 | 15.59 | 35.09 | 25.1 |
| 600 | 1 | 20.58 | 16.49 | 37.07 | 29.78 |
| 650 | 10 | 21.92 | 17.54 | 39.46 | 29.34 |
| 700 | 12 | 22.87 | 18.29 | 41.16 | 28.70 |
| 750 | 36 | 24.00 | 19.11 | 43.11 | 31.09 |
| 800 | 36 | 25.42 | 20.27 | 45.69 | 31.93 |
| 850 | 63 | 26.33 | 21.01 | 47.35 | 34.87 |
| 900 | 89 | 27.06 | 21.61 | 48.67 | 33.99 |
| 950 | 259 | 25.63 | 20.54 | 46.17 | 41.18 |
| 1000 | 126 | 28.68 | 22.86 | 51.54 | 38.63 |
Web Sockets results
| JMeter Threads | Number of errors | MB Received | MB Sent | MB Sent/Received | CPU Seconds |
|---|---|---|---|---|---|
| 100 | 1 | 0.64 | 0.70 | 1.34 | 1.06 |
| 150 | 0 | 0.97 | 1.04 | 2.01 | 1.67 |
| 200 | 0 | 1.29 | 1.39 | 2.68 | 2.24 |
| 250 | 0 | 1.61 | 1.74 | 3.35 | 2.66 |
| 300 | 2 | 1.93 | 2.09 | 4.02 | 6.3 |
| 350 | 1 | 2.26 | 2.44 | 4.70 | 3.45 |
| 400 | 1 | 2.58 | 2.78 | 5.37 | 3.78 |
| 450 | 8 | 2.91 | 3.13 | 6.04 | 4.01 |
| 500 | 11 | 3.24 | 3.48 | 6.72 | 4.42 |
| 550 | 26 | 3.58 | 3.83 | 7.41 | 4.74 |
| 600 | 4 | 3.93 | 4.17 | 8.11 | 5.17 |
| 650 | 41 | 4.27 | 4.52 | 8.79 | 5.57 |
| 700 | 31 | 4.78 | 4.87 | 9.65 | 6.31 |
| 750 | 69 | 4.93 | 5.22 | 10.15 | 6.30 |
| 800 | 118 | 5.33 | 5.57 | 10.90 | 6.68 |
| 850 | 32 | 5.68 | 5.92 | 11.60 | 7.53 |
| 900 | 209 | 6.13 | 6.26 | 12.39 | 8.36 |
| 950 | 443 | 6.51 | 6.61 | 13.12 | 8.35 |
| 1000 | 965 | 6.96 | 6.96 | 13.91 | 8.74 |
Terms:
- Errors - As reported by the client (JMeter).
- CPU Seconds - The increase of total CPU time for the server's docker container during the given test run.
- MB Sent/Received - The increase of total data sent/received for the server's docker container during the given test run.

Apart from a few anomalies, the CPU seems to increase linearly as the number of JMeter Threads is increased. The first polling run of 100 JMeter threads looks as if the JVM wasn't given enough of a warmup to optimise itself (or perhaps was busy optimising that it had to allocate more CPU resources). This would suggest that WebSockets (at least for this scenario) are far more efficient than Polling in terms of CPU.

Like the CPU graph, the total data sent and received increases linearly until the Polling implementation suffers so many errors that the total throughput starts to decrease as a result of client threads waiting for responses.
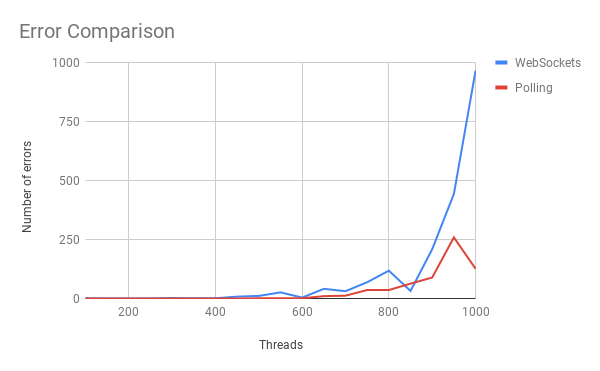
Up until around six hundred threads, the errors for both scenarios seem to be negligible, as the threads are increased we see both scenarios start to give errors with every further run. At eight hundred threads a tipping point is met for the WebSockets and we see errors exponentially increase.

What are the errors?
Most errors were due to the client not receiving a completed job after eleven seconds. This is the reason for all errors in the polling and around ninety seven percent of the errors encountered with the WebSocket tests. This would suggest that the server is so overloaded that the RXJava code doesn't get enough time to fire the events at the correct times to mark jobs as complete. This same issue strangely effects the WebSocket variant more despite it consistently performing less CPU activity than the polling variant. I have no explanation for this at present.
A small number of errors (around 3% of all errors) were encountered by the WebSocket JMeter tests as they waited for a connection to the server.
Other interesting points
The WebSocket performance tests required more than 2GB of memory to prevent JMeter from failing with OutOfMemoryErrors! This might suggest a memory leak in either my WebSocket test or the JMeter plugin used.
Conclusion
WebSockets can be far more efficient in terms of CPU resources and data sent/received. The figures and graphs shown above are obviously only relevant to my one hypothetical scenario. The following factors will obviously contribute to how much CPU and data is saved when comparing the two implementations:
- Cost of polling query - My example is very low cost, an in memory check. If another service needs to be queried (e.g. a DB) then increased load on that will also need to be considered.
- Polling frequency - If you don't have to be super responsive, you can keep halving your load by doubling your polling frequency.
Whilst the benefits of a WebSocket implementation are clear to see in the above graphs, so to are the errors. Both solutions suffer when the server is "stressed", but the WebSocket implementation seems to degrade earlier and faster with my example. Doubtless these service degradation issues could be addressed with tweaks, monitoring and auto-scaling.
Comments
Post a Comment